Earlier this month, Utah Foundation held a Breakfast Briefing looking at income inequality. Utah Foundation has also dedicated multiple Significant Statistics posts to looking at how income inequality varies across the state. We found that urban counties in Utah have the same levels of inequality when compared to more-rural counties (though income baselines varied significantly). However, the broad analysis obscures some of the detail, showing wide variation in inequality among counties and regions. Similarly, looking at the county-level alone obscures some of the detail within counties.
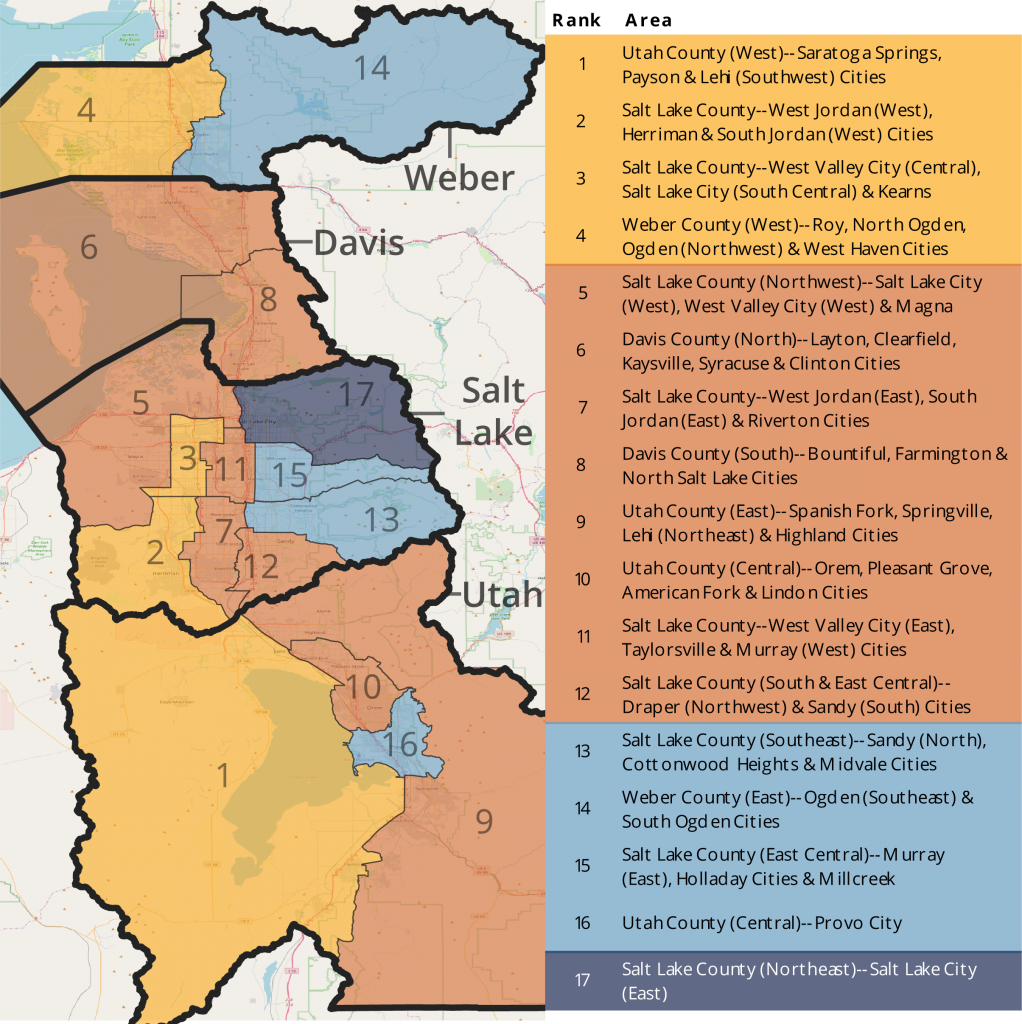
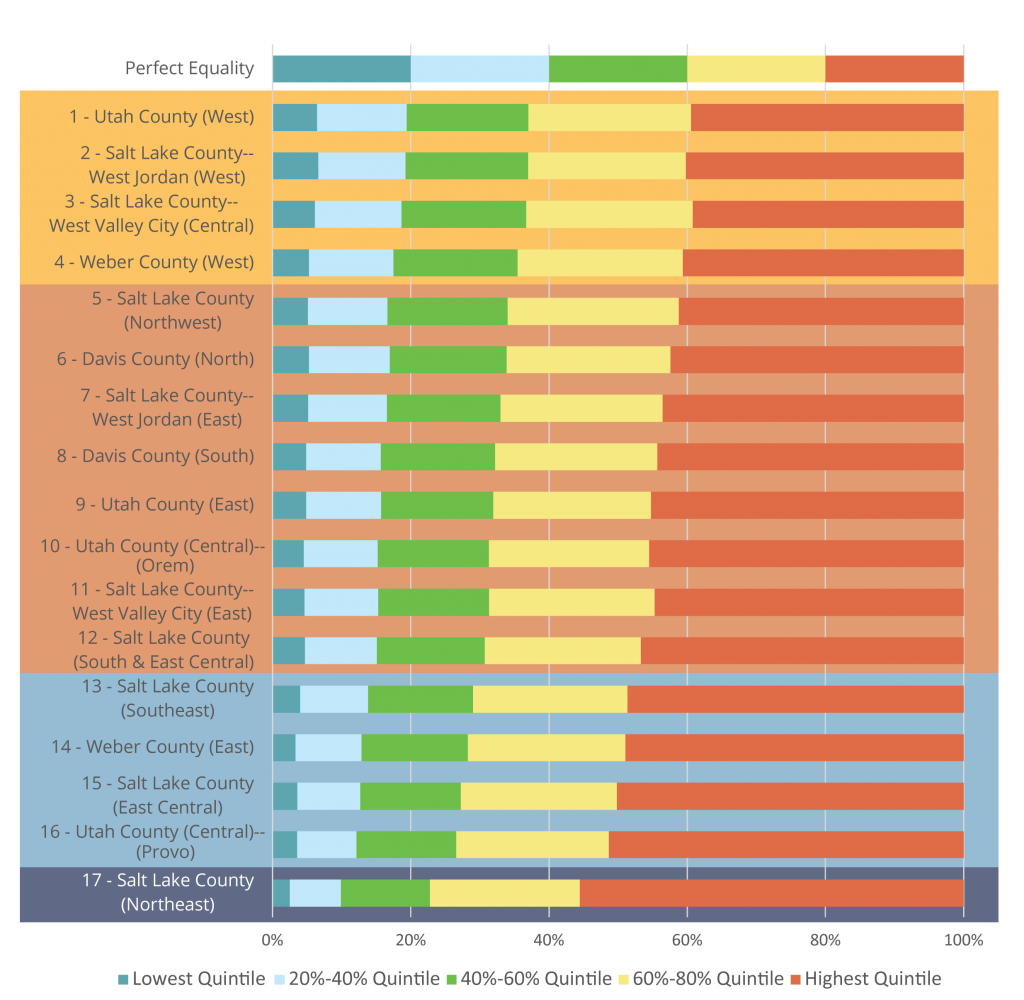
The U.S. Census provides survey data on sub-county areas in four counties: Davis, Salt Lake, Utah and Weber. When analyzing these data, Utah Foundation grouped households in each geography into five equally-sized groups ordered by income (quintiles). (In a theoretically equal society each group would earn 20% of the geography’s income.) Utah Foundation then ranked each geography based on how much it varied from perfect equality (with one being the least unequal) and divided them into groups based on their level of inequality, creating the map below.[1]
Figure 1: Map of Wasatch Front Inequality, Ranked from Most Equal to Least Equal
Northeast Salt Lake County (which contains much of Salt Lake City) stood out as the most unequal area. Interestingly, Salt Lake, Utah and Weber counties all had areas among the most and least unequal. Davis County’s two area, by contrast, are nearly identical. Davis County also stood out from previous research as being both one of the most equal counties as well as having the highest median income.
Figure 2: Wasatch Front Inequality, Ranked from Most Equal to Least Equal
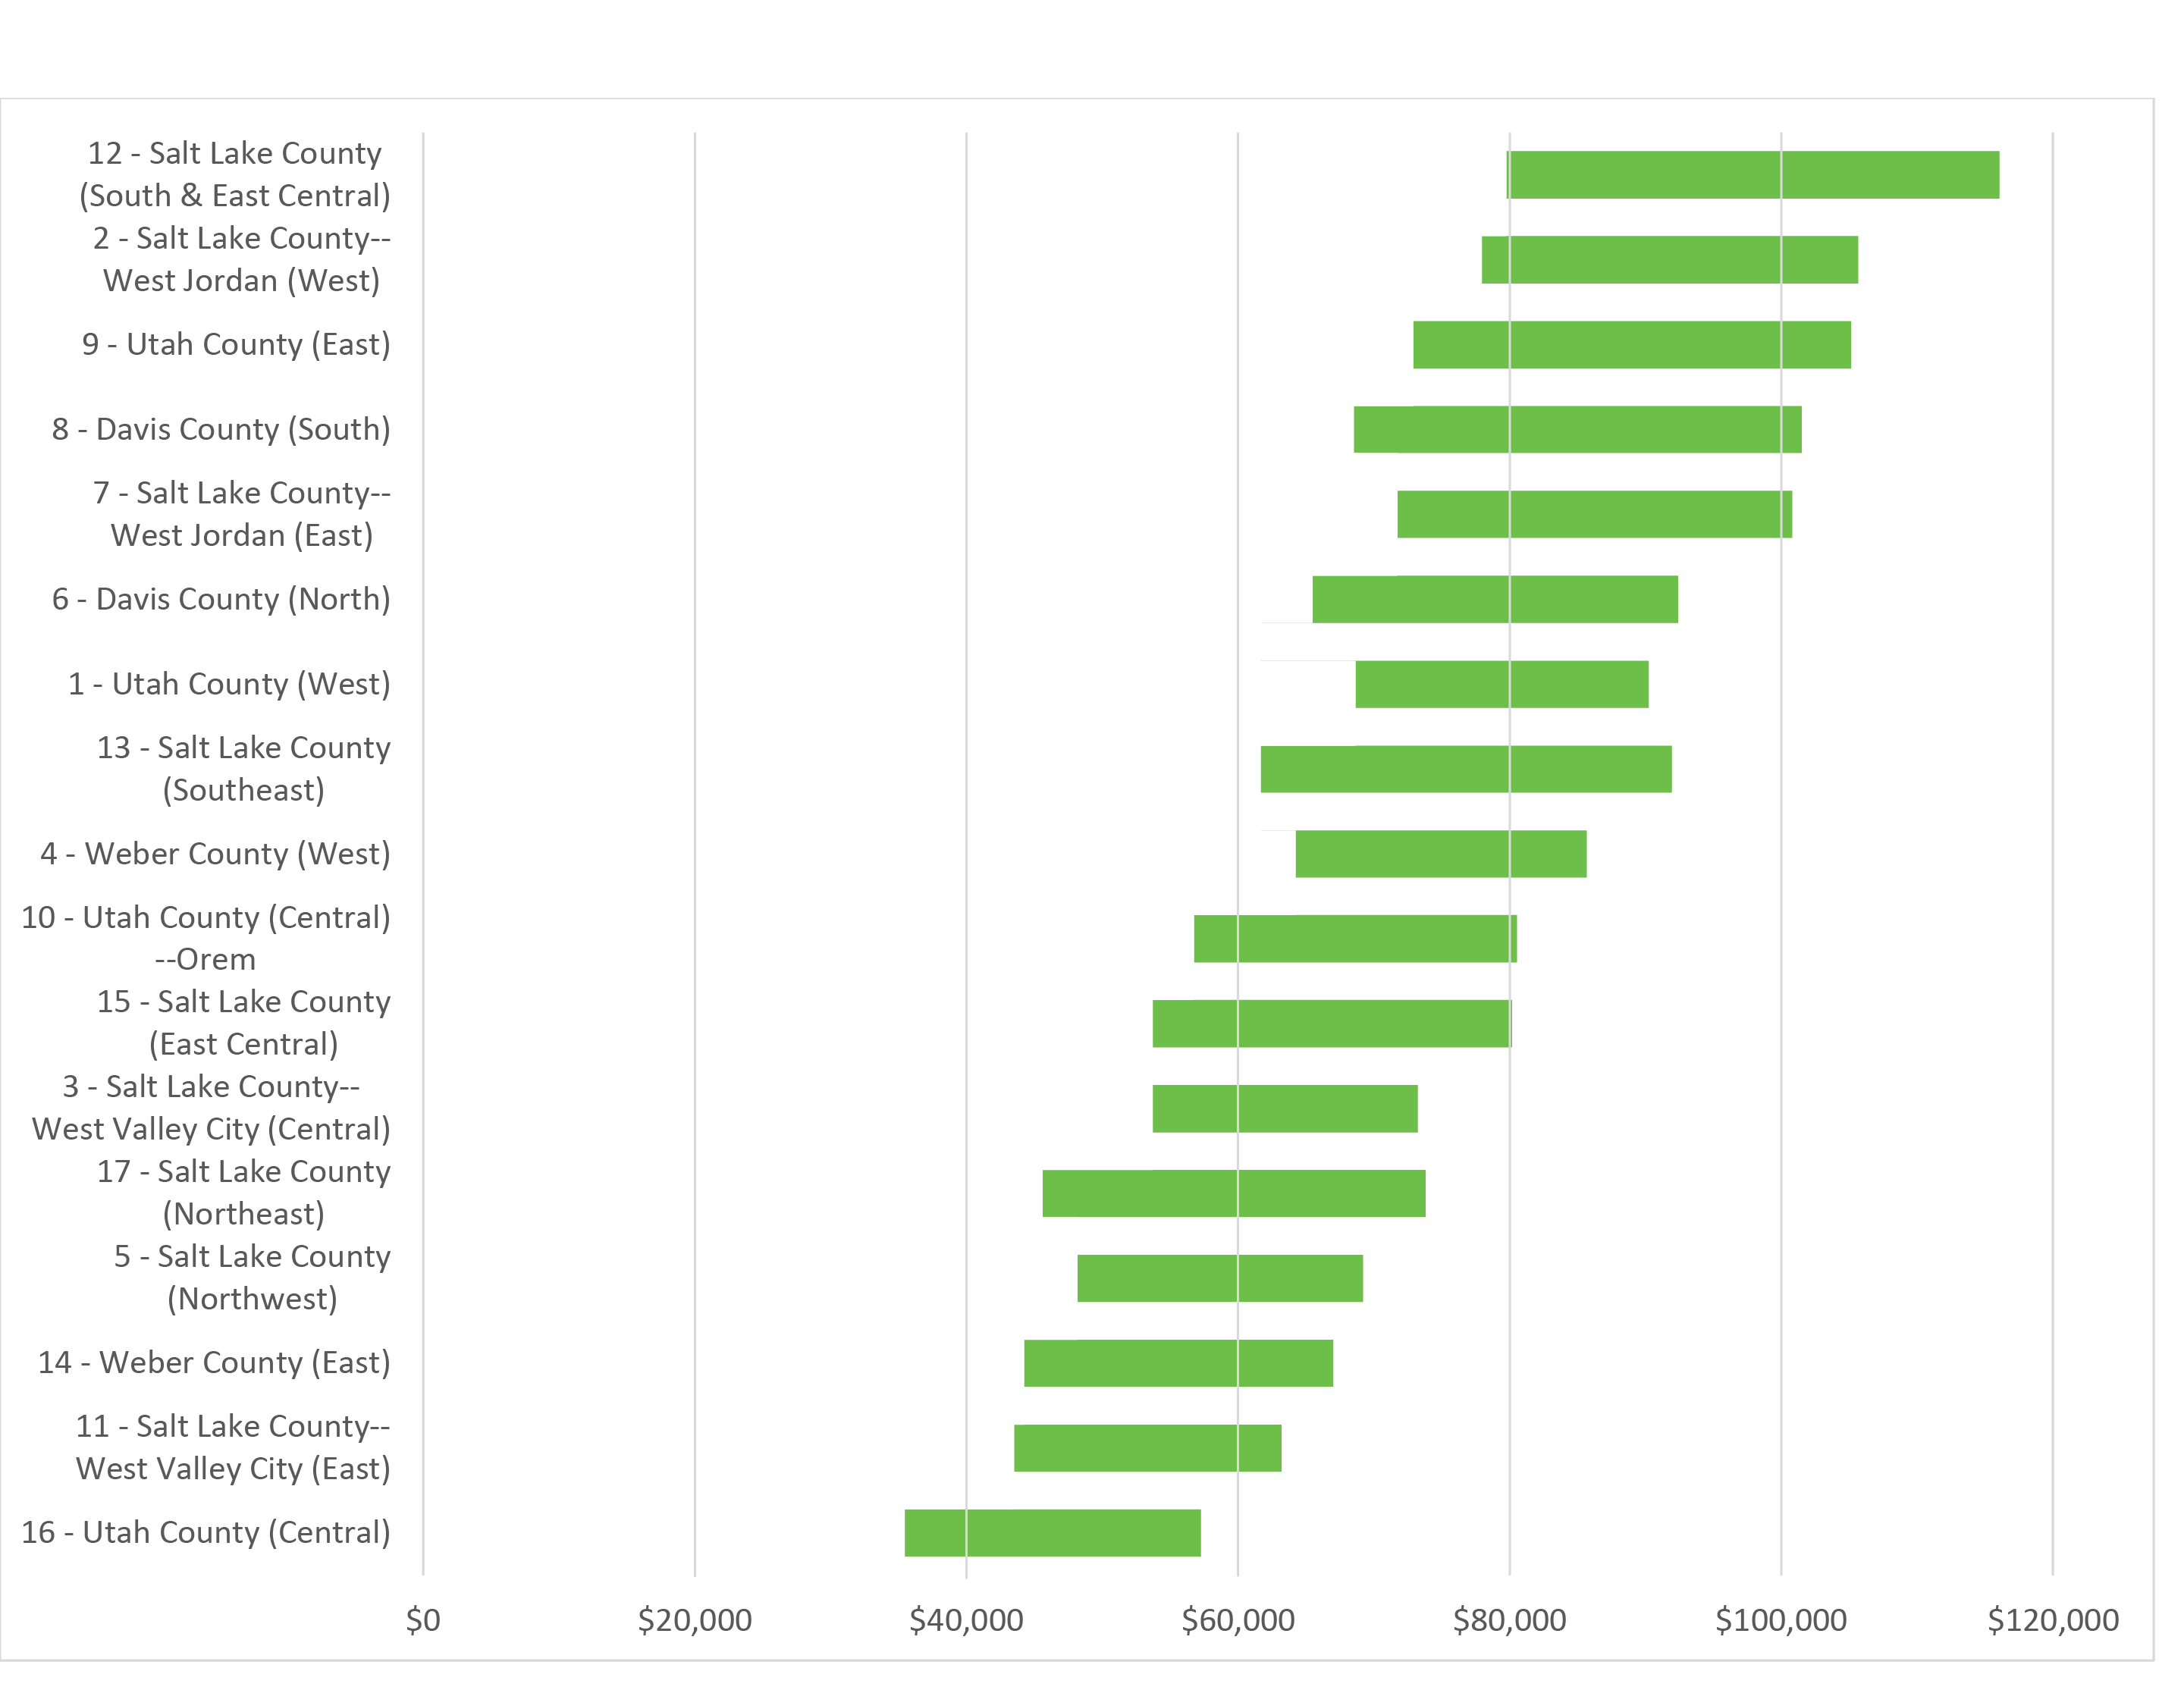
However, there is more to the story. Even if a place were perfectly equal, that would not necessarily mean it is prosperous. Figure 3 looks at just the middle quintile (those between the 40%-60% percentile of highest income earners) to get a sense of the baseline income. The median income ranges from $46,000 in the Provo area to more than twice that at $99,000 in the Sandy/Draper area (shown on Figure 3 as Salt Lake County (South & East Central)).
Figure 3: Wasatch Front Middle-Quintile Incomes, with Inequality Rankings
While West Jordan (West) and West Valley (Central) have similarly low levels of inequality (ranked 2 and 3 respectively) they have vastly different baselines; the median household income in West Jordan (West) is $93,000, but only $63,000 in West Valley (Central). Utah County (East) and Utah County (Central)–Orem, which are ranked 9 and 10 respectively, tell a similar story.
[1] The variation from perfect equality was simply calculated as the sum of the squares. The Gini coefficient, a common measure of inequality is calculated in a similar manner, but with more complex data.
Categories:


